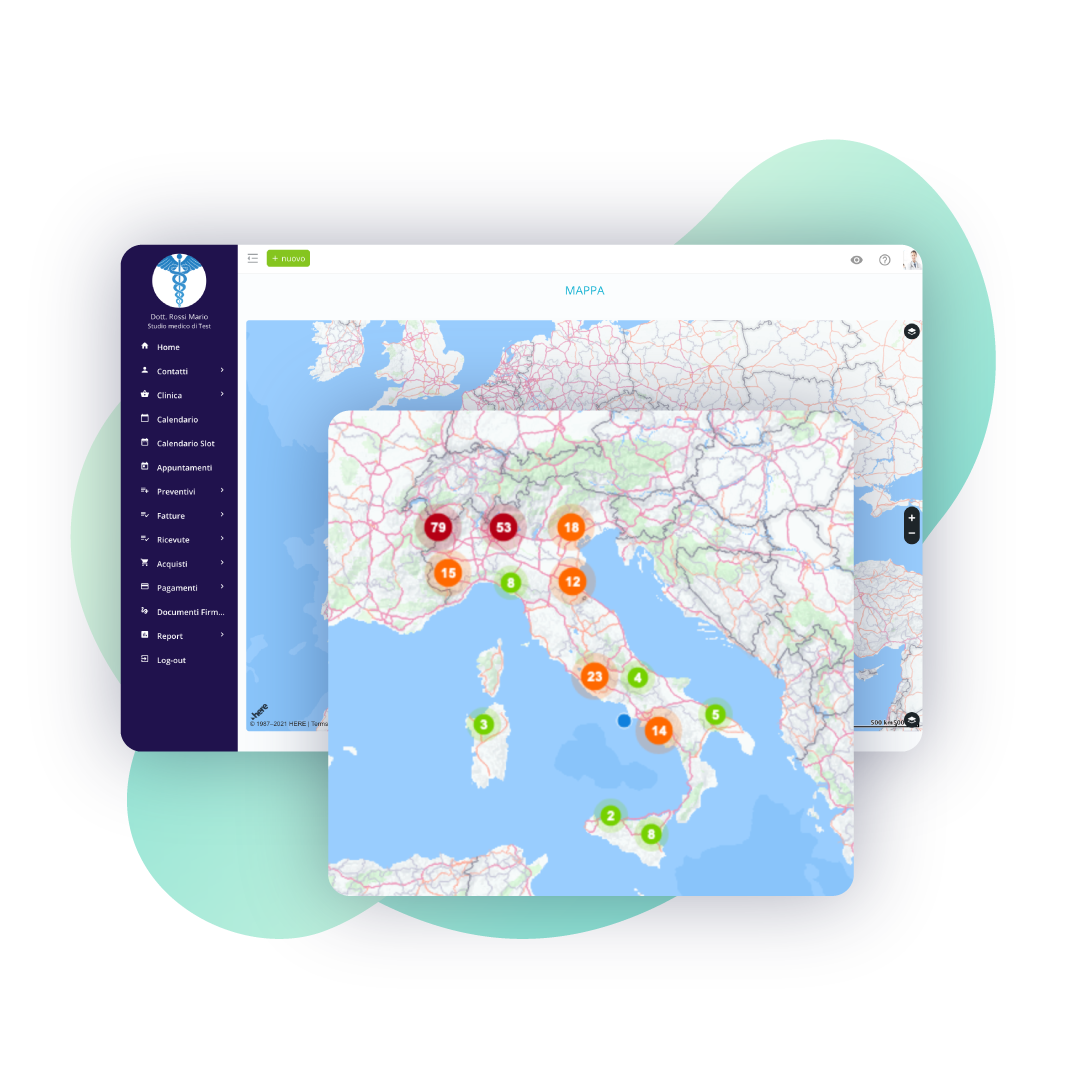
Graphic and reports on economical and pratical trends
Don't just insert data, Beebeeboard can help you to read and understand it!
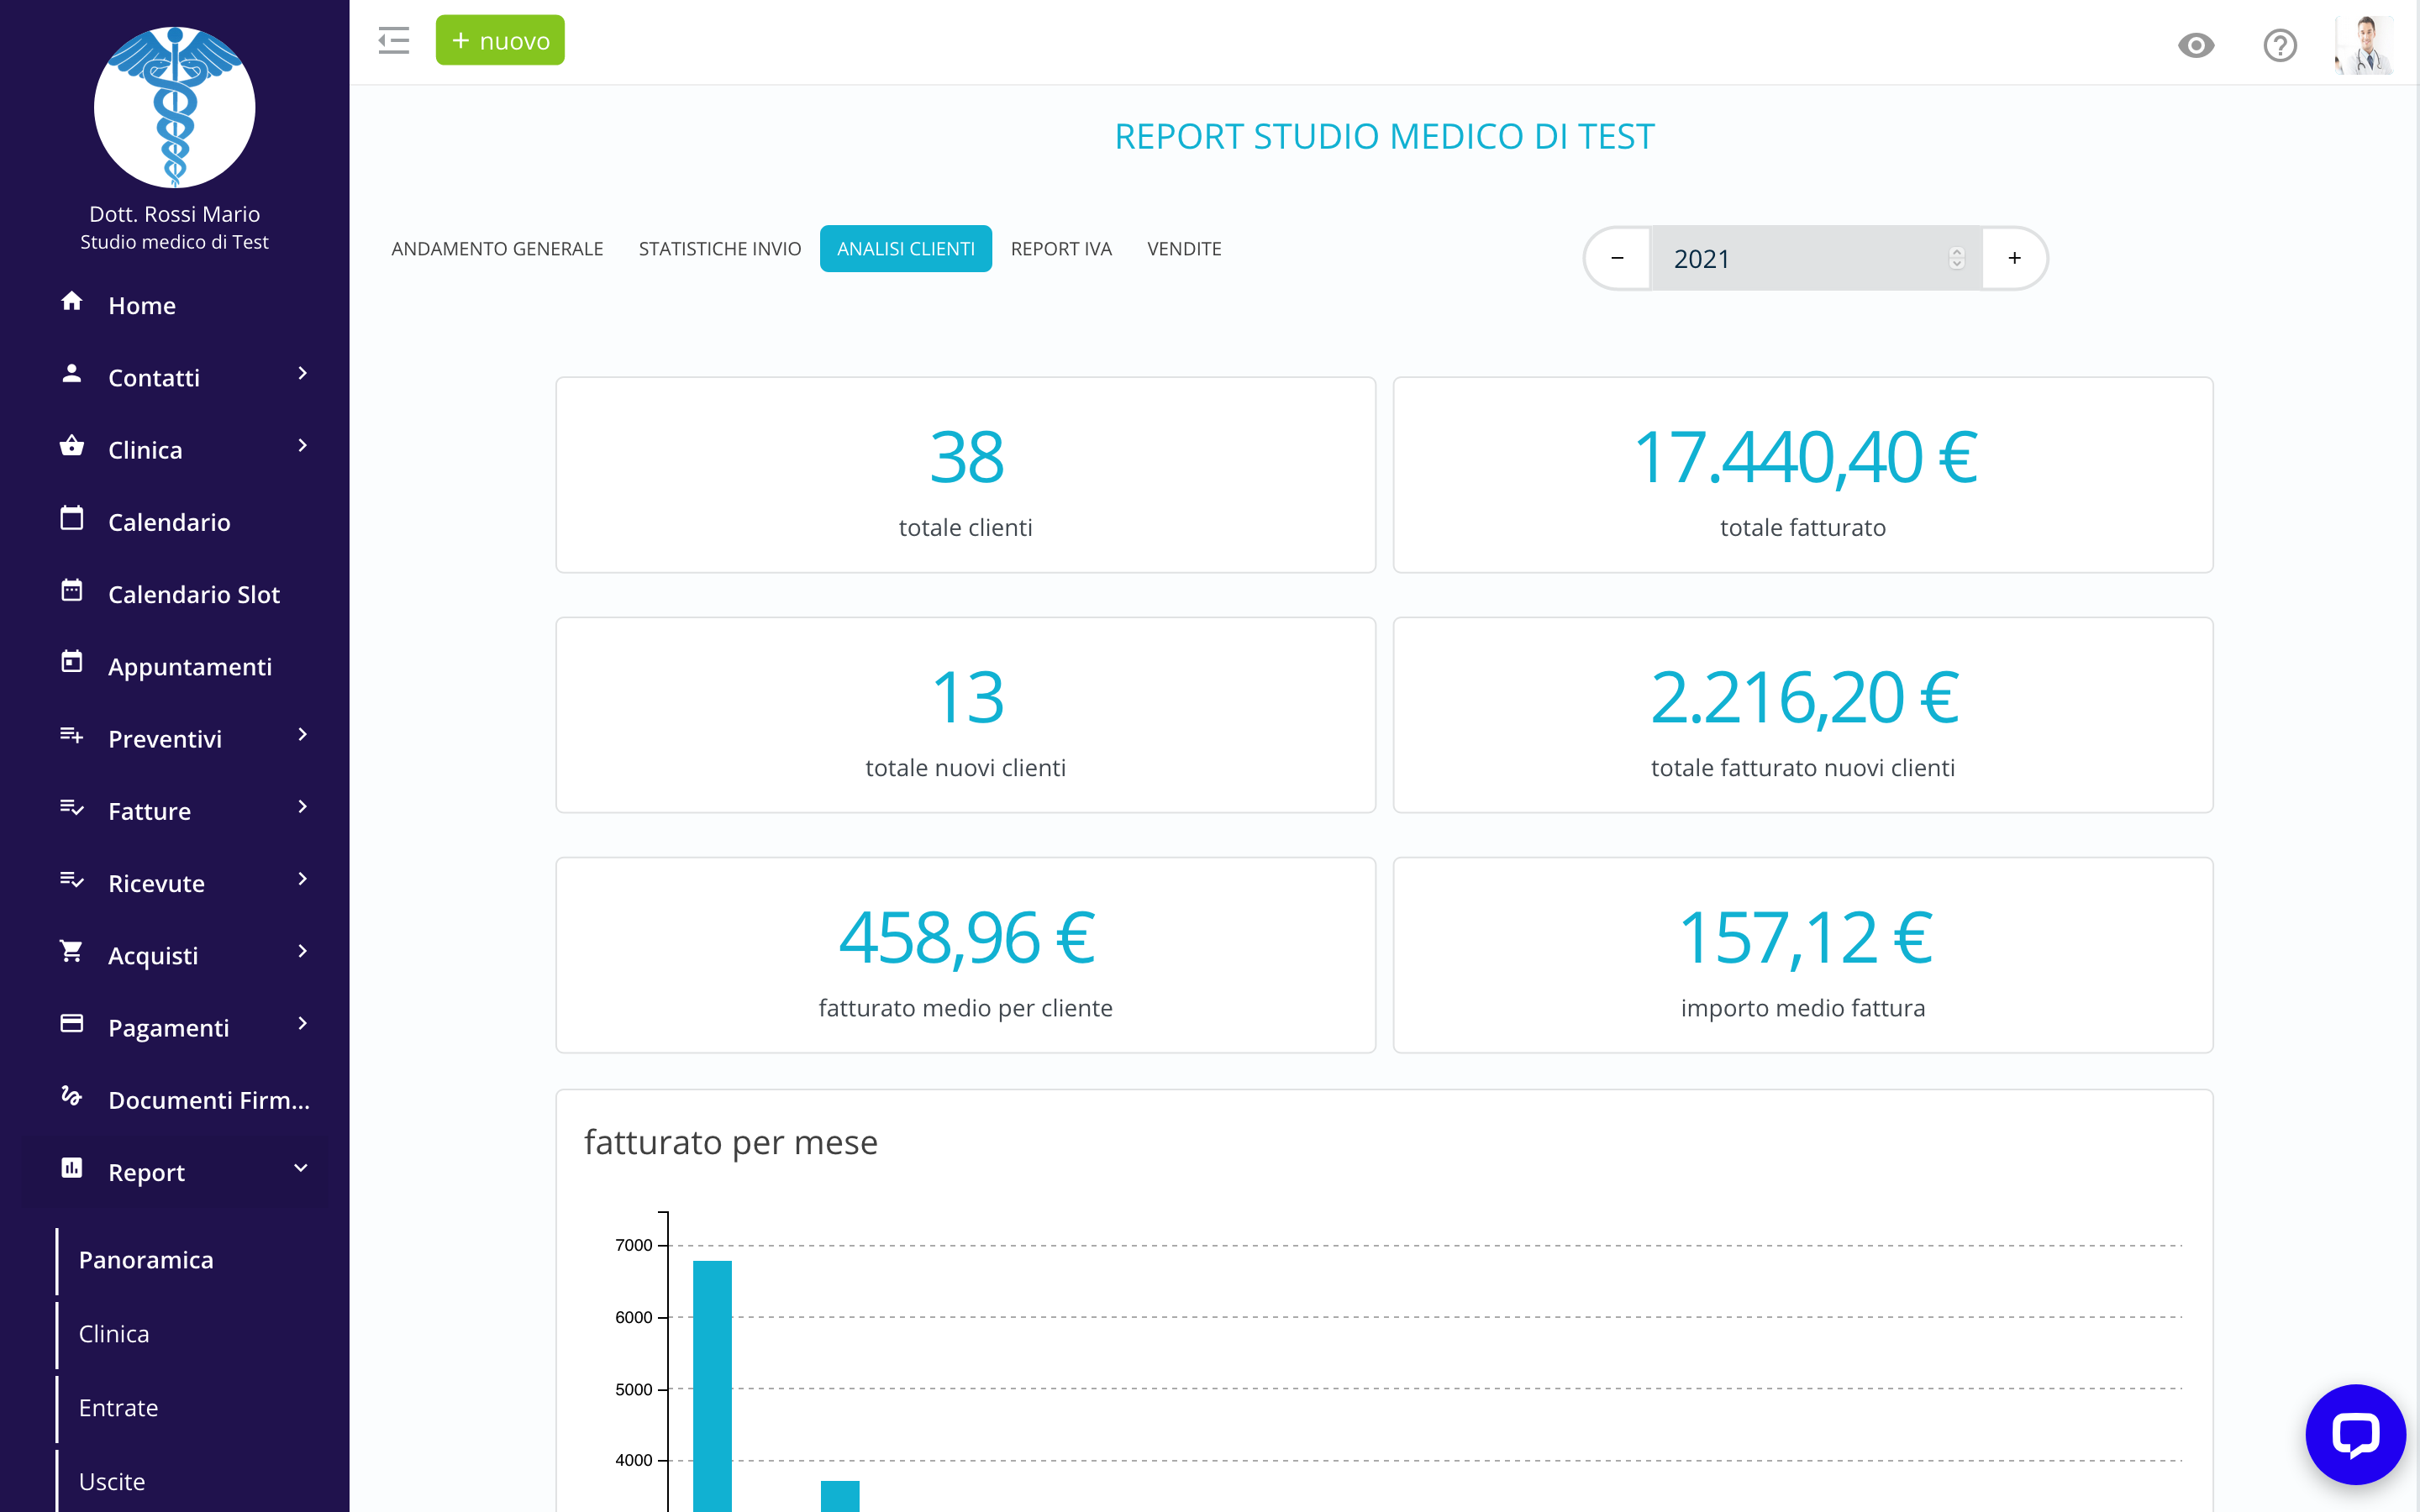
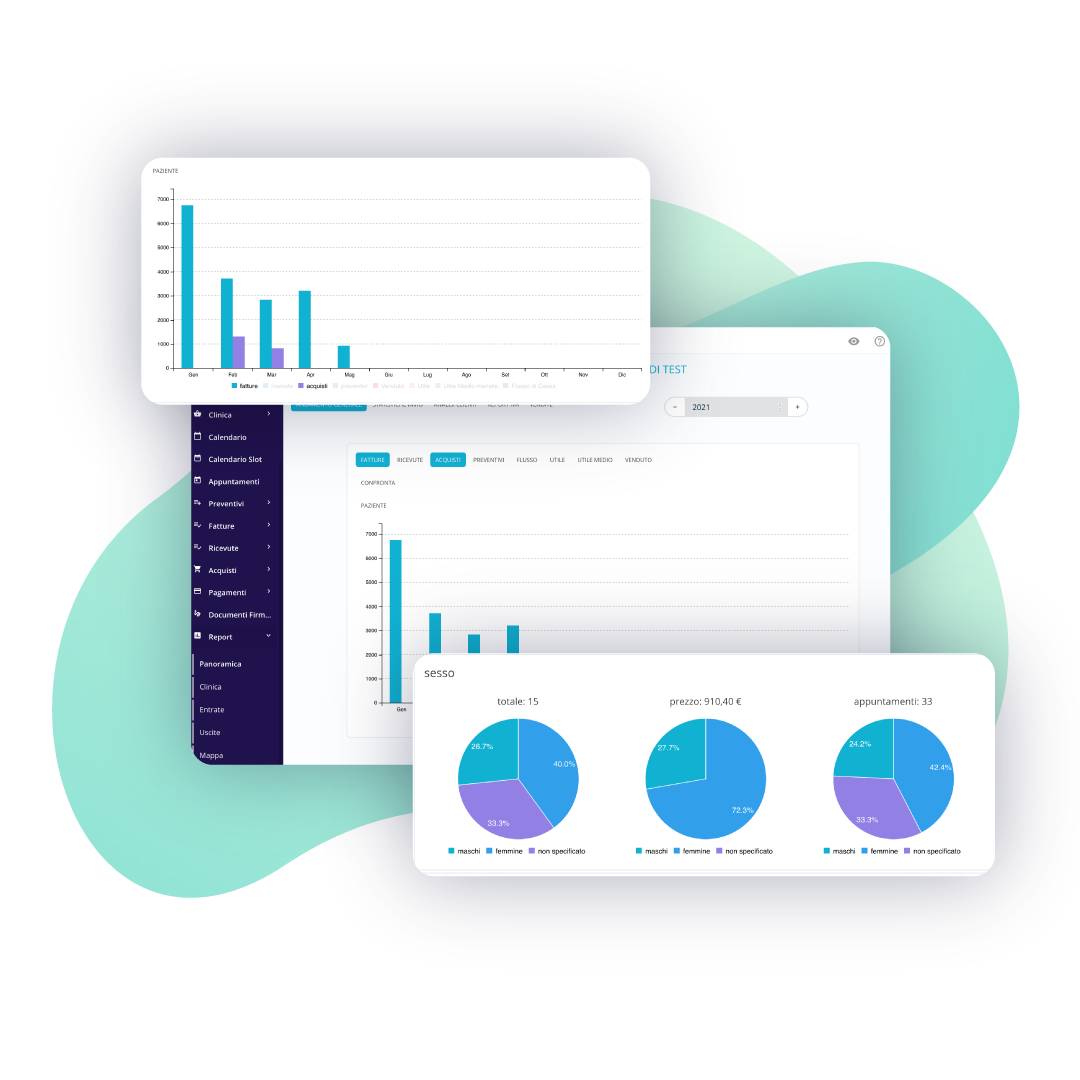
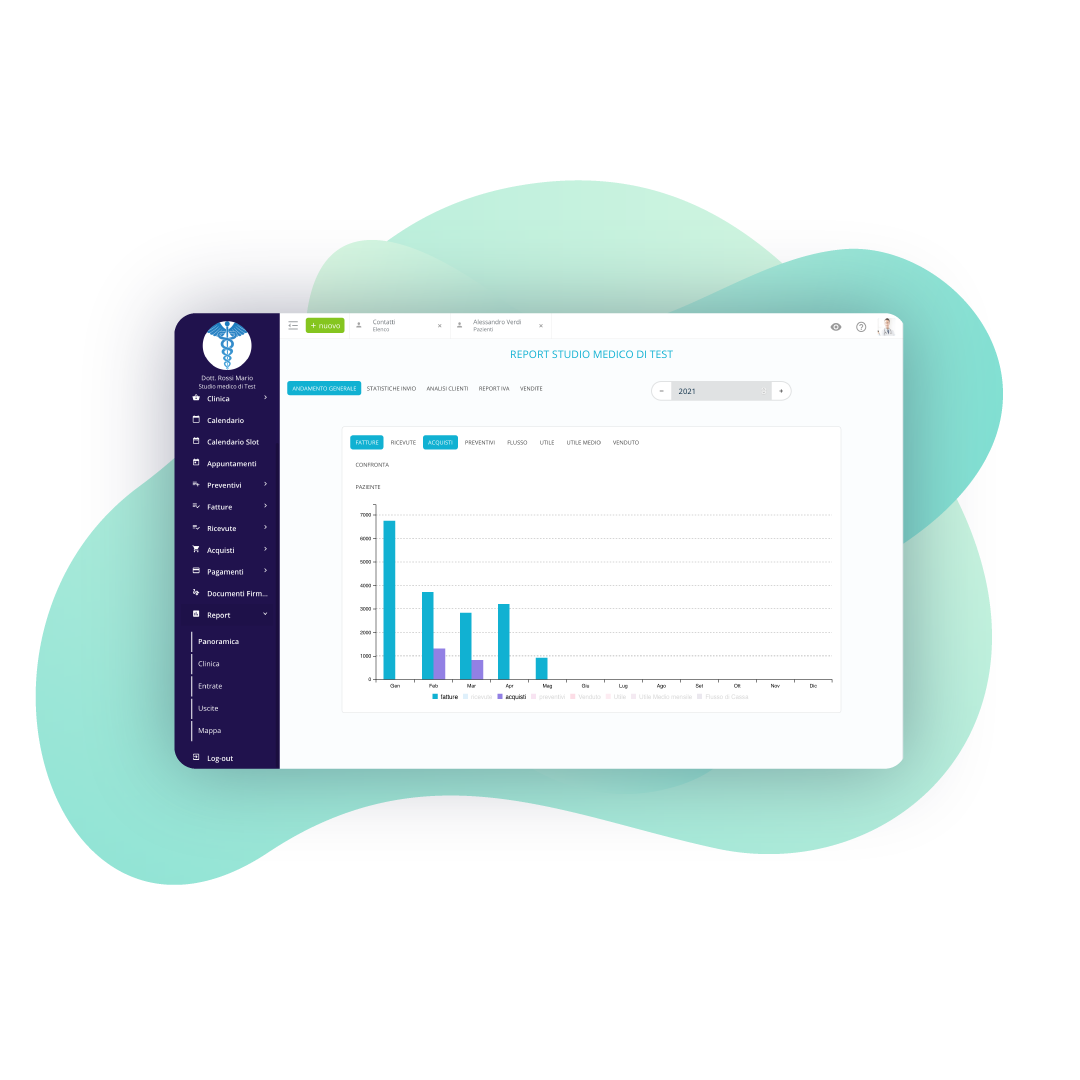
It's not always easy to read and interpret data, that's why the report section can help you to better control and understand all the information
0K
0K
0K
0+
Questions
How do I calculate the percentage due to each specialist?
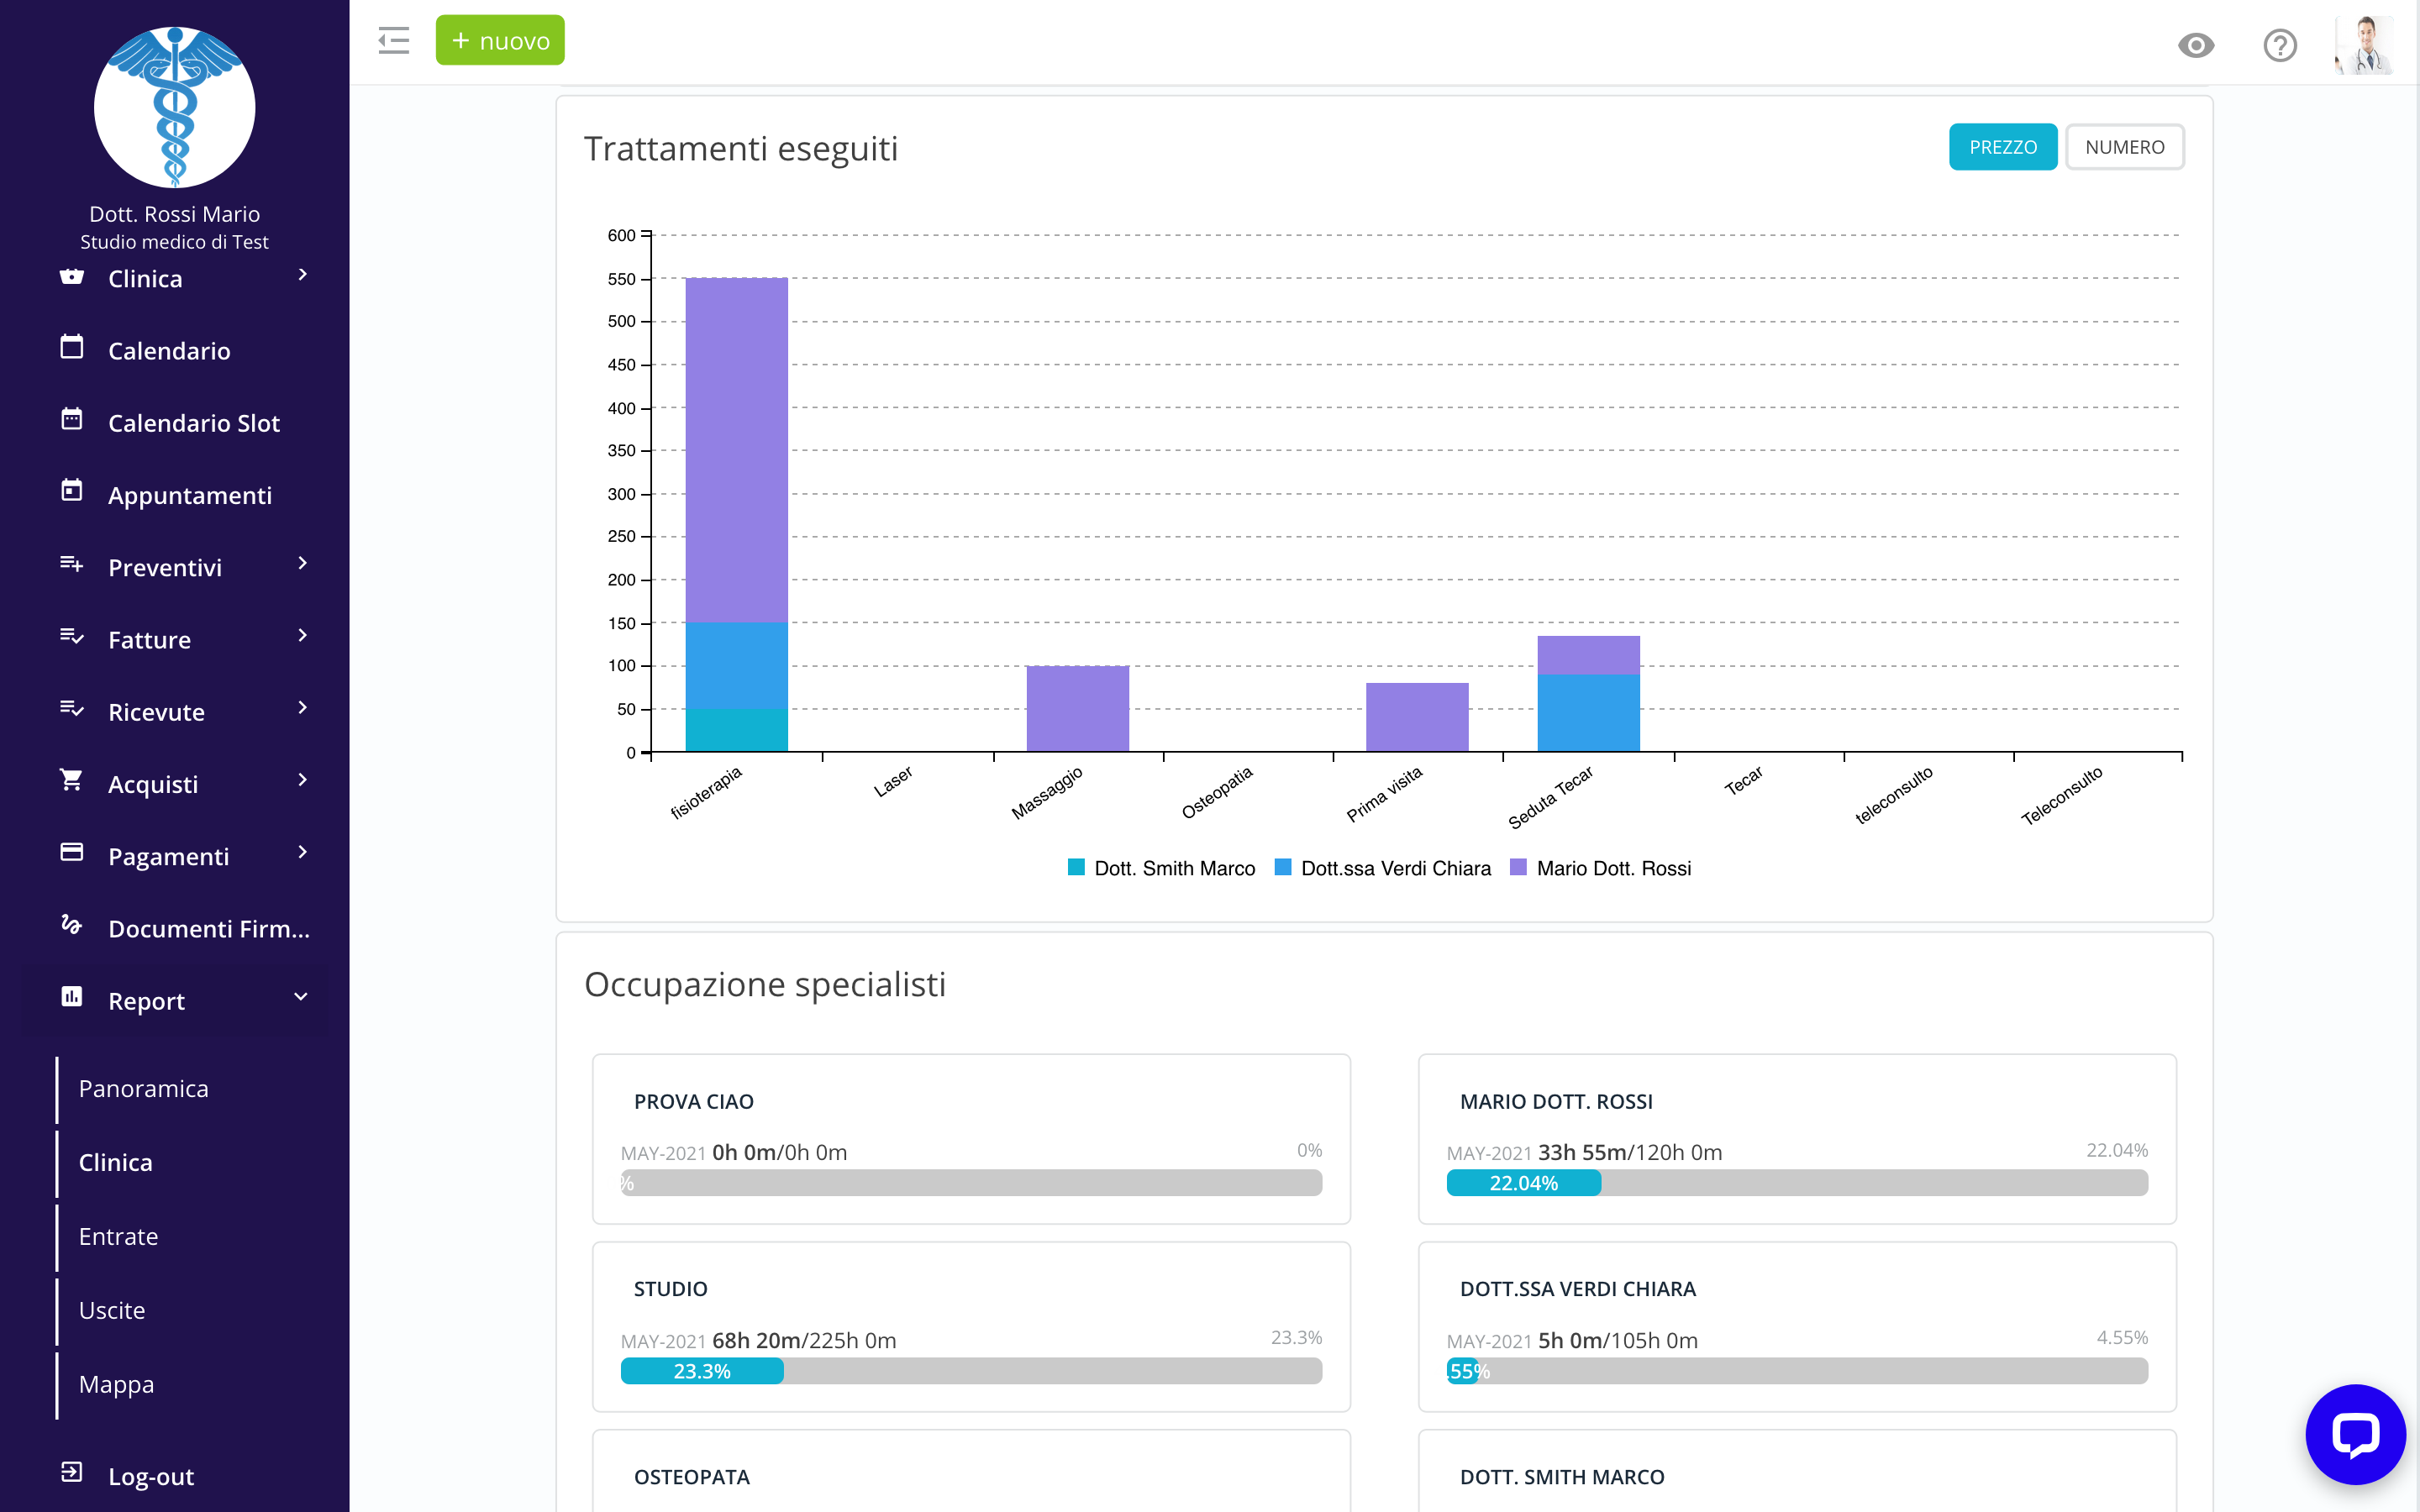
Surely the most appreciate report is the automatic count of percentage to give to each specialist. The count can be done in 4 different way:
- number of appointment: if you have a fixed rate for each appointment
- turnover attributable to each specialist
- number of treatments performed
- dedicated price list: for each treatment you can indicate price or percentage dedicated to each specialist
Does the map populate automatically?
When you are filling out your client’s address, Beebeeboard suggest you an address based on what you were typing in, if you click on the suggestion Beebeeboard will geologicalize the client on the map
Can I somehow segment my patients?
Beebeeboard allows you to segment your customers using different aspects, first you can segment patients that prefer to be contacted my email or SMS. Second you can segment them by sex, age, no shows, date of first appointment..
What are the VAT report and the Withholding Tax report?
In case you are using account payable, it’s probably that sometimes the amount is not the total to pay because there is a small amount to pay next month. In this case you always have a dedicated report that tells you how much you still have to pay.
The VAT report instead, it’s a graphic that compare active and passive VAT
